Your cart is currently empty!
Cost Effectiveness of Nutrition Policies on Processed Meat: Implications for Cancer Burden in the U.S.
All your purchased models will be available under your account under “Dashboards”
Disease Area (Primary)
Colorectal and stomach cancer
First Developed
07/07/2017
Last Developed
01/14/2019
Software Used
R (e.g., heemod, BCEA, dampack, hesim)
Model Sponsor
Government agency
Intervention
nutrition_policy
Model Validation Score
– %
Coming Soon In Phase II: You will be able to pay a fee to download the CADTH Tool for your model which includes subaggregated scores.
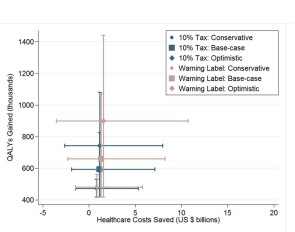
Results
Over a lifetime, the 10% excise tax would prevent 77,000 colorectal (95% uncertainty interval=56,800, 107,000) and 12,500 stomach (95% uncertainty interval=6,880, 23,900) cancer cases, add 593,000 (95% uncertainty interval=419,000, 827,000) quality-adjusted life years, and generate net savings of $2.7 billion from societal perspectives. The warning label policy would avert 85,400 (95% uncertainty interval=56,600, 141,000) and 15,000 (95% uncertainty interval=6,860, 34,500) colorectal and stomach cancer cases and add 660,000 (95% uncertainty interval=418,000, 1,070,000) quality-adjusted life years with net savings of $4.5 billion from societal perspectives. In subgroup analyses, greater health and economic benefits accrued to (1) younger subpopulations, (2) subpopulations with greater cancer risk, and (3) those with higher baseline processed meat consumption.
Conclusion
What are the key conclusions or current applications of this model?
Source File(s)
Model Review
Only visible for the model owner
Summary
Validation Score
– %
Internal Comments
–
Full review
| 01 Model Built Reflective | yes |
|---|---|
| 02 Model Subgroups | yes |
| 03 Model Assesses all comparators | yes |
| 04 Model Incorporates costs | yes |
| 05 Model assesses all outcomes | yes |
| 06 Model structure validated by experts | yes |
|---|---|
| 07 Model aligns with or justifies deviation from previous models | yes |
| 08 Time in health states | yes |
|---|---|
| 09 Consistency with time in states | yes |
| 10 Clinical events extractable | yes |
| 11 Consistency with number of clinical events | yes |
| 12 Impact of adverse events | yes |
| 13 Consistency with adverse events | yes |
| 14 Life-years reported | yes |
| 15 Impact on mortality | yes |
| 16a Reasons for mortality differences | yes |
| 16b Reasons for mortality differences | yes |
| 16c Reasons for mortality differences | yes |
| 16d Reasons for mortality differences | yes |
| 17 Main driver of incremental life-years | yes |
| 18 Consistency with mortality rates | yes |
| 19 No technology-specific utilities used | yes |
| 20 Main driver of cost-effectiveness | yes |
| 21 Extrapolation methods identified | yes |
| 22 Adjustable time horizon | yes |
| 23 Double counting avoided | yes |
| 24 Surrogate vs final outcomes alignment | yes |
| 25 Flexibility for treatment effect waning | yes |
| 26 Access to deterministic and Monte Carlo results | yes |
|---|---|
| 27 Clear trace from inputs to outcomes | yes |
| 28 Macros used only for simulation/navigation (Excel) | yes |
| 29 QALY equivalence across technologies | yes |
|---|---|
| 30 Extreme effectiveness impact on QALY | yes |
| 31 Slight effectiveness impact on QALY | yes |
| 32 Increased mortality lowers QALYs | yes |
| 33 Reduced mortality increases QALYs | yes |
| 34 Increased baseline risk lowers QALYs | yes |
| 35 Reduced baseline risk increases QALYs | yes |
| 36 Zero mortality leads to equal life-years | yes |
| 37 Cost change affects only total costs | yes |
| 38 Utilities = 1 makes QALYs equal life-years | yes |
| 39 No discounting increases QALYs/costs | yes |
| 40 Higher discounting decreases QALYs/costs | yes |
| 41 Shorter time horizon lowers QALYs/costs | yes |
| 42 Inputs switchable across alternatives | yes |
| 43 Cost-QALY correlation across simulations | yes |
| 44 Strong cost correlation from Monte Carlo | yes |
| 45 Strong QALY correlation from Monte Carlo | yes |
| 46 Deterministic ≈ Probabilistic results | yes |
| 47 Backward trace from results to inputs | yes |
|---|---|
| 48 Backward trace from results to inputs | yes |
| 49 No use of non-transparent Excel functions | yes |
|---|---|
| 50 No hidden sheets, rows, or columns | yes |
| 51 No custom formulas inside VBA macros | yes |
| 52 Parameters persist after macros | yes |
| 53 Transparent input structure in single worksheet | yes |
| Private internal comments | – |

