Your cart is currently empty!
Evaluating the impact of universal Lynch syndrome screening in a publicly funded healthcare system
All your purchased models will be available under your account under “Dashboards”
Disease Area (Primary)
Lynch syndrome
First Developed
07/23/2020
Last Developed
07/23/2020
Software Used
R (e.g., heemod, BCEA, dampack, hesim)
Model Sponsor
Unknown
Intervention
universal_screening
Model Validation Score
20 %
Coming Soon In Phase II: You will be able to pay a fee to download the CADTH Tool for your model which includes subaggregated scores.
Results
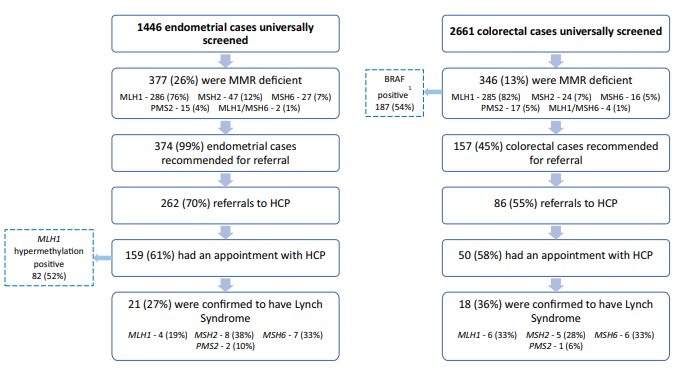
The mutation detection rate of the universal screening group was higher than the traditionally referred group (45/228 (19.7%) vs 50/390 (12.5%), P = .05), though each were able to identify unique patients. An analysis of testing criteria met by each patient showed that half of referred patients from the universal screening group could not meet any traditional testing criteria.
Conclusion
The implementation of universal screening in a publicly funded system will increase efficiency in detecting patients with LS.
Source File(s)
Model Review
Only visible for the model owner
Summary
Validation Score
20 %
Internal Comments
–
Full review
| 01 Model Built Reflective | yes |
|---|---|
| 02 Model Subgroups | yes |
| 03 Model Assesses all comparators | yes |
| 04 Model Incorporates costs | yes |
| 05 Model assesses all outcomes | yes |
| 06 Model structure validated by experts | yes |
|---|---|
| 07 Model aligns with or justifies deviation from previous models | yes |
| 08 Time in health states | yes |
|---|---|
| 09 Consistency with time in states | yes |
| 10 Clinical events extractable | yes |
| 11 Consistency with number of clinical events | yes |
| 12 Impact of adverse events | yes |
| 13 Consistency with adverse events | yes |
| 14 Life-years reported | yes |
| 15 Impact on mortality | yes |
| 16a Reasons for mortality differences | yes |
| 16b Reasons for mortality differences | yes |
| 16c Reasons for mortality differences | yes |
| 16d Reasons for mortality differences | yes |
| 17 Main driver of incremental life-years | yes |
| 18 Consistency with mortality rates | yes |
| 19 No technology-specific utilities used | yes |
| 20 Main driver of cost-effectiveness | yes |
| 21 Extrapolation methods identified | yes |
| 22 Adjustable time horizon | yes |
| 23 Double counting avoided | yes |
| 24 Surrogate vs final outcomes alignment | yes |
| 25 Flexibility for treatment effect waning | yes |
| 26 Access to deterministic and Monte Carlo results | yes |
|---|---|
| 27 Clear trace from inputs to outcomes | yes |
| 28 Macros used only for simulation/navigation (Excel) | yes |
| 29 QALY equivalence across technologies | yes |
|---|---|
| 30 Extreme effectiveness impact on QALY | yes |
| 31 Slight effectiveness impact on QALY | yes |
| 32 Increased mortality lowers QALYs | yes |
| 33 Reduced mortality increases QALYs | yes |
| 34 Increased baseline risk lowers QALYs | yes |
| 35 Reduced baseline risk increases QALYs | yes |
| 36 Zero mortality leads to equal life-years | yes |
| 37 Cost change affects only total costs | yes |
| 38 Utilities = 1 makes QALYs equal life-years | yes |
| 39 No discounting increases QALYs/costs | yes |
| 40 Higher discounting decreases QALYs/costs | yes |
| 41 Shorter time horizon lowers QALYs/costs | yes |
| 42 Inputs switchable across alternatives | yes |
| 43 Cost-QALY correlation across simulations | yes |
| 44 Strong cost correlation from Monte Carlo | yes |
| 45 Strong QALY correlation from Monte Carlo | yes |
| 46 Deterministic ≈ Probabilistic results | yes |
| 47 Backward trace from results to inputs | yes |
|---|---|
| 48 Backward trace from results to inputs | yes |
| 49 No use of non-transparent Excel functions | yes |
|---|---|
| 50 No hidden sheets, rows, or columns | yes |
| 51 No custom formulas inside VBA macros | yes |
| 52 Parameters persist after macros | yes |
| 53 Transparent input structure in single worksheet | yes |
| Private internal comments | – |

