Your cart is currently empty!
Modeled Reductions in Late-stage Cancer with a Multi-Cancer Early Detection Test
All your purchased models will be available under your account under “Dashboards”
Disease Area (Primary)
Cancer
First Developed
01/13/2020
Last Developed
–
Software Used
R (e.g., heemod, BCEA, dampack, hesim)
Model Sponsor
Pharmaceutical or medical device company
Intervention
screening
Model Validation Score
– %
Coming Soon In Phase II: You will be able to pay a fee to download the CADTH Tool for your model which includes subaggregated scores.
Results
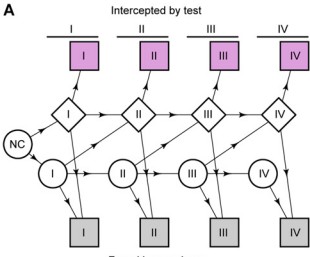
The MCED test could intercept 485 cancers per year per 100,000 persons, reducing late-stage (III-IV) incidence by 78% in those intercepted. Accounting for lead time, this could reduce 5-year cancer mortality by 39% in those intercepted, resulting in an absolute reduction of 104 deaths per 100,000, or 26% of all cancer-related deaths. Findings are robust across tumor growth scenarios.
Conclusion
What are the key conclusions or current applications of this model?
Source File(s)
Model Review
Only visible for the model owner
Summary
Validation Score
– %
Internal Comments
–
Full review
| 01 Model Built Reflective | yes |
|---|---|
| 02 Model Subgroups | yes |
| 03 Model Assesses all comparators | yes |
| 04 Model Incorporates costs | yes |
| 05 Model assesses all outcomes | yes |
| 06 Model structure validated by experts | yes |
|---|---|
| 07 Model aligns with or justifies deviation from previous models | yes |
| 08 Time in health states | yes |
|---|---|
| 09 Consistency with time in states | yes |
| 10 Clinical events extractable | yes |
| 11 Consistency with number of clinical events | yes |
| 12 Impact of adverse events | yes |
| 13 Consistency with adverse events | yes |
| 14 Life-years reported | yes |
| 15 Impact on mortality | yes |
| 16a Reasons for mortality differences | yes |
| 16b Reasons for mortality differences | yes |
| 16c Reasons for mortality differences | yes |
| 16d Reasons for mortality differences | yes |
| 17 Main driver of incremental life-years | yes |
| 18 Consistency with mortality rates | yes |
| 19 No technology-specific utilities used | yes |
| 20 Main driver of cost-effectiveness | yes |
| 21 Extrapolation methods identified | yes |
| 22 Adjustable time horizon | yes |
| 23 Double counting avoided | yes |
| 24 Surrogate vs final outcomes alignment | yes |
| 25 Flexibility for treatment effect waning | yes |
| 26 Access to deterministic and Monte Carlo results | yes |
|---|---|
| 27 Clear trace from inputs to outcomes | yes |
| 28 Macros used only for simulation/navigation (Excel) | yes |
| 29 QALY equivalence across technologies | yes |
|---|---|
| 30 Extreme effectiveness impact on QALY | yes |
| 31 Slight effectiveness impact on QALY | yes |
| 32 Increased mortality lowers QALYs | yes |
| 33 Reduced mortality increases QALYs | yes |
| 34 Increased baseline risk lowers QALYs | yes |
| 35 Reduced baseline risk increases QALYs | yes |
| 36 Zero mortality leads to equal life-years | yes |
| 37 Cost change affects only total costs | yes |
| 38 Utilities = 1 makes QALYs equal life-years | yes |
| 39 No discounting increases QALYs/costs | yes |
| 40 Higher discounting decreases QALYs/costs | yes |
| 41 Shorter time horizon lowers QALYs/costs | yes |
| 42 Inputs switchable across alternatives | yes |
| 43 Cost-QALY correlation across simulations | yes |
| 44 Strong cost correlation from Monte Carlo | yes |
| 45 Strong QALY correlation from Monte Carlo | yes |
| 46 Deterministic ≈ Probabilistic results | yes |
| 47 Backward trace from results to inputs | yes |
|---|---|
| 48 Backward trace from results to inputs | yes |
| 49 No use of non-transparent Excel functions | yes |
|---|---|
| 50 No hidden sheets, rows, or columns | yes |
| 51 No custom formulas inside VBA macros | yes |
| 52 Parameters persist after macros | yes |
| 53 Transparent input structure in single worksheet | yes |
| Private internal comments | – |

